GEOD
image (4)
Other Earth-science applications of the image command
The image command provides several other useful functions in Earth sciences.
In particular, it makes it possible to colour the outcrop areas of different geological formations on a DEM from structural data, namely azimuth and dip measured at several points.
Summary
- Determining the geographic extent of a geological structure
- Digitizing contour lines and constructing the DEM
- The outcrop instruction
- Basic syntax
- Adjusting thickness with thickness
- Changing the colouring with color
- Marking the outcrop point with control
- Placing the top of the bed at the outcrop point with below
- Placing the base of the bed at the outcrop point with above
- Restricting the outcrop extent with leftrange, rightrange, and extent
Determining the geographic extent of a geological structure
A DEM is very useful for accurately mapping geological structures when their characteristics, such as azimuth, dip, thickness, and so on, have been well established in the field. GEOD provides a few basic functions for geological mapping.
These functions are illustrated here with a classic academic example in which the objective is to map a bed with azimuth N150E, dip 30° toward the SW, and thickness 45 metres.

Figure 1 : Topographic map with contour lines. The dotted formation is a bed with azimuth N150E and dip 30° toward the SW.
Digitizing contour lines and constructing the DEM
The first step is to digitize the contour lines with the mouse. These are stored with line commands.

Figure 2 : Digitizing contour lines. Five contour lines are digitized for elevations of 100, 150, 200, 250, and 300 metres.
Next, the image, that is, the DEM, is erased with a plane instruction:
plane erase
The contour lines are then redrawn directly onto the DEM with the zline instruction from the digitized curves. In order to constrain elevations more effectively at summits and depressions, one also uses zpoint instructions to fix a few spot heights. At this stage, one obtains the following figure:

Figure 3 : Image obtained after applying the plane, zline, and zpoint instructions.
One may then apply a voronoi instruction to check that the DEM is well constrained. If necessary, the relief representation may be refined. One also uses the zmin and zmax instructions when the elevations fall outside the 0 to 255 metre range, which is the case here.

Figure 4 : Application of the voronoi instruction to the previous figure.
Since the Voronoi diagram appears satisfactory, one applies the MNT instruction from the first draft of the figure and obtains the DEM shown in figure 5.

Figure 5 : Application of the MNT instruction.
As explained above, this DEM is then saved with an export instruction, and it is from this saved version that one will be able to determine the outcrop areas of faults or geological beds.
The outcrop instruction
The outcrop instruction is used to colour on the DEM the outcrop area of a planar geological structure, whether a fault or a bed, from its structural data, namely the coordinates of an outcrop point, azimuth, and dip.
Basic syntax
Several syntactic forms are available for this instruction.
The simplest one is:
outcrop x y azimuth slope
where the instruction is followed by four numeric values:
- x and y give the coordinates of the outcrop point in the natural reference system associated with the DEM, that is, in number of pixels.
- azimuth gives the azimuth of the plane in degrees, that is, the angle between the north direction and a horizontal line of the plane.
- slope gives the dip of the plane in degrees. With a positive azimuth, dip values between 0 and 90° produce a plane dipping toward the west or south, whereas dip values between -90° and 0° produce a plane dipping toward the north or east.
For example, to produce the drawing of figure 6, one writes:
outcrop 190 420 150 38
This corresponds to a plane of azimuth N150E, dip 38° toward the SW, and outcropping at the point x = 190 and y = 420.

Figure 6 : Drawing of a planar bed with azimuth N150E and dip 38° toward the SW. The yellow triangle indicates the outcrop point of the bed from which the outcrop area is reconstructed.
Another possible syntax is:
outcrop x x y y azimuth slope
In this case, the values x and y are preceded by the keywords x and y. They indicate here the coordinates of the outcrop point in the reference system associated with the GEOD figure. Thus, if the DEM is moved within the figure, these coordinates will no longer refer to the same point on the DEM.
A third possible syntax is to precede the coordinate values by the keywords xref and yref:
outcrop xref x yref y azimuth slope
In this case, x and y give the coordinates of the outcrop point in the reference system associated with the DEM by the reference instruction.
Adjusting thickness with thickness
By default, GEOD draws a bed 2 metres thick on the DEM. It is possible to adjust the thickness with the thickness instruction. This instruction must follow the outcrop instruction.
  outcrop ...
      thickness e
where e must be replaced by the thickness in metres.
The outcrop area of the bed is coloured as an overlay on the DEM on both sides of the outcrop point.

Figure 7 : Drawing of a planar bed with azimuth N50E and dip 20° toward the NW. The blue triangle indicates the outcrop point of the bed. Thickness is set to 50 m with a thickness 50 instruction.
Changing the colouring with color
By default, the outcrop area is coloured in red. This colour may be changed with the color instruction. The syntax is:
color colorName
where colorName must be replaced by one of the following words: red, green, blue, yellow, cyan, magenta, black, or white.
These eight available colours make it possible to construct a first draft of a geological map in a region made of monoclinal beds.

Figure 8 : Drawing of a geological map with the help of outcrop ... thickness ... color ... instructions.
Marking the outcrop point with control
It is possible to display the dip symbol measured at the outcrop point on the DEM. To do this, one uses the control instruction:
control

Figure 9 : Drawing of the dip symbol at the outcrop point with the control instruction. The symbol corresponds to a bed N50E 20° NW.
Placing the top of the bed at the outcrop point with below
By default, GEOD assumes that the outcrop point lies in the middle of the bed. This behaviour may be modified with the above and below instructions.
The below instruction indicates that the bed lies below the outcrop point, which therefore marks the top of the bed.
below
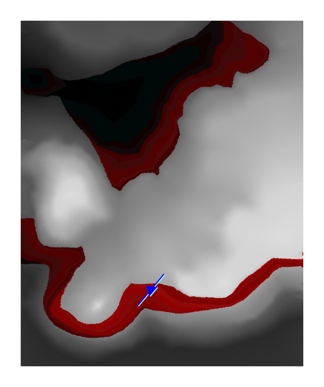
Figure 10 : Drawing of the bed with the below instruction. The outcrop point, shown by the blue dip symbol, marks the top of the bed.
Placing the base of the bed at the outcrop point with above
Conversely to the below instruction, one may indicate to GEOD that the bed must be drawn above the outcrop point, which then indicates the base of the bed.
above

Figure 11 : Drawing of the bed with the above instruction. The outcrop point, shown by the blue dip symbol, marks the base of the bed.
Restricting the outcrop extent with leftrange, rightrange, and extent
The azimuth and or dip of a geological bed are generally not constant over the whole DEM. In this case, the outcrop area drawn by an outcrop instruction is valid only in a region centred on the place where azimuth and dip were measured. This is why it is sometimes necessary to restrict the outcrop area.
Three instructions are available for this purpose: leftrange, rightrange, and extent.
- leftrange restricts the area on the left, that is, west of the outcrop point. For example:
leftrange 10
restricts the outcrop area to a 10 metre band on the left.
- rightrange restricts the area on the right, that is, east of the outcrop point. For example:
rightrange 27
restricts the outcrop area to a 27 metre band on the right.
- extent restricts the area around the outcrop point. Thus,
extent 50
restricts the coloured area to a lozenge-shaped region of half-width 50 metres around the outcrop point.

Figure 12 : In red are drawn two horizontal beds with the help of two outcrop instructions. By default, all possible outcrop points of these two beds on the DEM are coloured. The colouring may be restricted with leftrange, rightrange, or extent instructions.