FITane
User guide — Microthermometric analysis of H2O-CH4-NaCl fluid inclusions containing gas hydrates
FITane is a software package developed for the interpretation of microthermometric data from fluid inclusions containing methane or carbon dioxide gas hydrates. It is designed to help reconstruct the physical and chemical properties of geological fluids and to estimate their trapping temperature and pressure.
The software is particularly suited to the study of aqueous saline inclusions containing CH4 and/or CO2, in which hydrate formation and dissociation provide key constraints on fluid composition and density.
This page presents the main principles of the software, the input data required, and the workflow used to estimate the trapping conditions of these geological fluids.
The software can be downloaded here: Download FITane.
Scientific purpose
Fluid inclusions containing methane or carbon dioxide hydrates provide important information on the nature of fluids circulating in sedimentary basins, hydrothermal systems, and other geological environments. Microthermometric observations of these inclusions can be used to constrain:
- the salinity of the aqueous phase,
- the amount of dissolved CH4 or CO2,
- the density of the trapped fluid,
- the possible coexistence of aqueous liquid, gas, and hydrate,
- the temperature and pressure of trapping.
FITane combines these different observations in a consistent thermodynamic framework in order to derive quantitative estimates of the bulk properties of the inclusion fluid and its trapping conditions.
Main capabilities of FITane
The software allows the user to work from classical microthermometric measurements and to calculate the corresponding physical properties of the fluid inclusion.
Depending on the available data, FITane can be used to:
- interpret inclusions containing H2O-CH4-NaCl or related systems with gas hydrate formation,
- calculate fluid properties from measured phase transitions,
- estimate the density of the aqueous solution,
- evaluate methane content and salinity,
- plot P-T and density-composition relationships,
- estimate the trapping pressure and trapping temperature of the inclusion,
- compare several inclusions or several scenarios in the same project.
Input data
The main microthermometric data used by the program are entered in the Input data section of the interface.
The software can use several types of observations, among which:
- Tmi: ice melting temperature,
- Thyd: gas hydrate dissociation temperature,
- Th: total homogenization temperature,
- Fv: vapor fraction when this information is available.
These measured values are essential because they provide complementary constraints on the fluid system. Ice melting mainly constrains salinity, hydrate dissociation constrains gas content, and homogenization gives access to the density and to the isochores used for trapping reconstruction.
In the interface, the user can select the algorithm to be used, for example by working directly from Th or from Fv, depending on the available petrographic and microthermometric observations.
Bulk properties and trapping conditions
Once the microthermometric data are entered, the software calculates a set of bulk properties and derives possible trapping conditions.
The section dedicated to bulk properties and trapping conditions displays values such as:
- Tt: trapping temperature,
- Pt: trapping pressure,
- rho: bulk density of the trapped fluid.
These values correspond to the reconstructed properties of the inclusion at the time of trapping, assuming that the inclusion remained closed after entrapment and that the chosen thermodynamic models are appropriate for the fluid system under study.
Composition and units
The software allows the composition to be expressed in different forms, which can be selected through the tabs in the composition panel.
- Molalities,
- Weight %,
- Mole fractions,
- ppm.
This flexibility makes it possible to work with the unit system that is most convenient for the user or that best matches the published data and laboratory measurements.
In the example shown in the interface, the user enters methane and sodium chloride contents in mol/kg H2O. FITane then uses these values to calculate the associated phase relations and fluid properties.
Models available
The software includes several calculation panels and model selections that control the thermodynamic treatment of the data.
Among the available tabs, the interface provides access to:
- Pressures,
- P/T gradient,
- Error,
- Models,
- Trapping,
- Raman,
- Curves.
The Models tab allows the user to select the thermodynamic formulations used for methane solubility and for the density of aqueous solutions. This is useful when comparing alternative calibrations or when adapting the calculations to specific fluid systems.
The Error tab can be used to assess the influence of analytical uncertainty on the reconstructed fluid properties. This is important because small uncertainties on microthermometric temperatures may translate into significant uncertainties on pressure and density.
Graphical outputs
One of the main strengths of FITane is the direct graphical representation of the reconstructed fluid properties.
The software provides graphs such as:
- P-T diagrams,
- density diagrams,
- relationships between the density of methane and the density of the aqueous solution,
- visual markers for the different phase states of the system.
These graphical outputs help the user understand how the measured phase transitions constrain the fluid properties and how the trapping point is inferred from the available data.
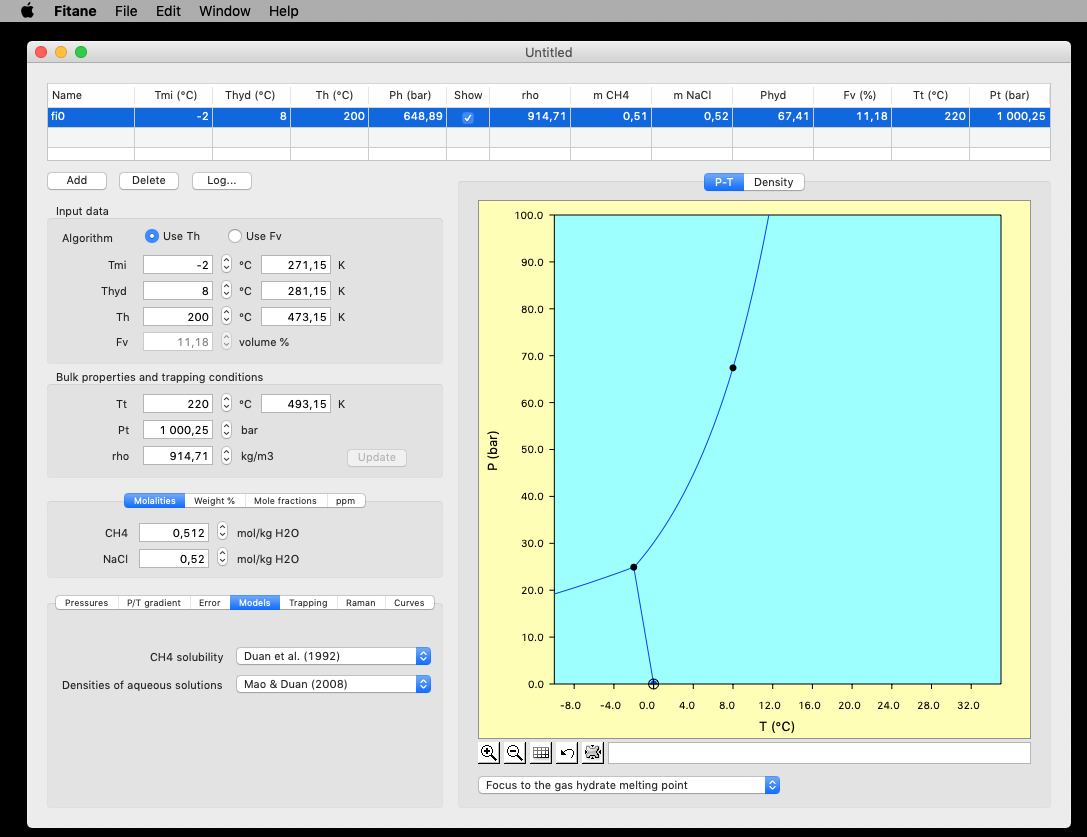
P-T diagram generated by FITane from microthermometric input data. The graph shows the phase relations used to constrain the pressure and temperature evolution of the inclusion fluid and to infer trapping conditions.
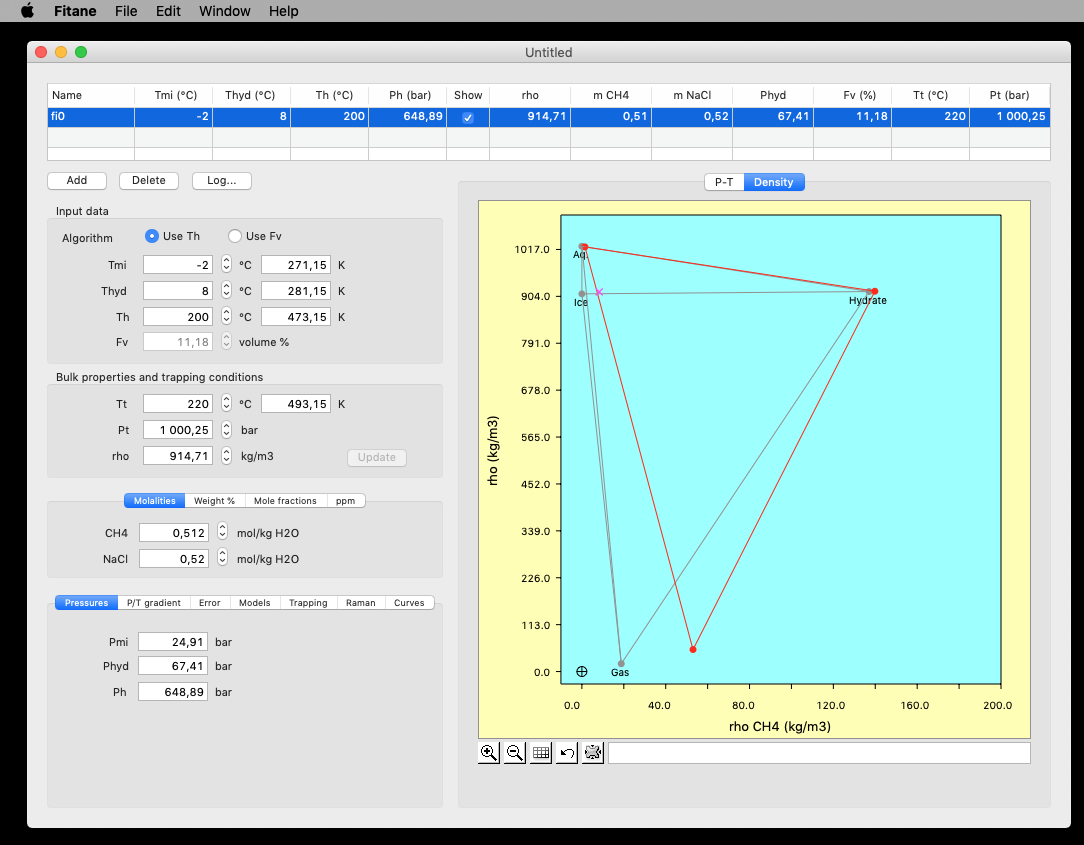
Density diagram generated by FITane. This representation illustrates the relationships between methane density, bulk density, hydrate stability and the inferred properties of the trapped fluid.
General workflow
A typical use of FITane follows the sequence below.
- observe the inclusion petrography and identify the phases present,
- measure the relevant microthermometric temperatures,
- enter the data into the software,
- choose the appropriate calculation mode,
- verify the fluid composition and selected thermodynamic models,
- inspect the calculated densities and phase relations,
- estimate the trapping temperature and pressure.
The software is therefore intended both as a calculation tool and as an aid for the interpretation of inclusion behavior during heating and cooling experiments.
Step-by-step user guide
1. Create or select an inclusion record
In the upper table, each line corresponds to one fluid inclusion or one calculation case. The user can create a new entry, delete one, or duplicate an existing case in order to test different hypotheses.
This makes it easy to compare several inclusions from the same sample or to explore the effect of uncertainties in the measured temperatures.
2. Enter the microthermometric data
In the Input data panel, fill in the measured temperatures:
- Tmi for ice melting,
- Thyd for hydrate dissociation,
- Th for homogenization,
- Fv if vapor fraction measurements are available.
Choose the algorithm that best matches the available data. In many cases, the homogenization temperature is the main input, but in some studies the vapor fraction may also provide useful additional constraints.
3. Enter composition data
In the composition panel, select the preferred unit system and enter the estimated amounts of dissolved methane and salt.
These values may come from the direct interpretation of phase transitions, from Raman spectroscopy, or from iterative adjustment based on the consistency of the calculated results.
4. Check calculated pressures and densities
The software then calculates intermediate properties such as:
- the hydrate equilibrium pressure,
- the homogenization-related pressure,
- the density of the trapped fluid,
- the density of the aqueous solution,
- the methane contribution to the overall fluid behavior.
These values are displayed in the corresponding panels and can be used to verify whether the entered data are thermodynamically coherent.
5. Estimate trapping conditions
The final step consists in determining the most plausible trapping temperature and trapping pressure. These are shown in the bulk properties section and can also be visualized graphically.
The trapping conditions are derived from the intersection of the relevant thermodynamic constraints and therefore reflect the best estimate compatible with the entered data and selected models.
Interpretation of the main interface panels
Top table
The table at the top of the interface summarizes the main parameters and calculated properties for each inclusion. It allows rapid comparison between multiple inclusions and gives direct access to values such as measured temperatures, bulk density, vapor fraction, and trapping conditions.
Input data panel
This panel contains the raw experimental observations. It is the starting point of the calculation and should be filled with carefully checked microthermometric values.
Bulk properties and trapping conditions panel
This panel provides the reconstructed values for the inclusion as a whole. It is especially important for geological interpretation because it links laboratory measurements to the physical conditions prevailing during fluid entrapment.
Composition panel
This area is used to specify the amount of dissolved methane and salt. Because different studies use different concentration units, the possibility of switching between units is particularly useful.
Model and calculation tabs
These tabs provide access to the details of the calculations and to the available thermodynamic formulations. They allow the user to go beyond simple input-output usage and to examine how the estimates are obtained.
Graphical panel
The graph on the right-hand side dynamically displays the results. It provides an immediate visual interpretation of the calculated equilibrium relations and of the inferred trapping point.
Recommended use and precautions
As with any thermodynamic reconstruction, the quality of the result depends on the quality of the observations and on the validity of the assumptions used.
The following points should be kept in mind:
- the inclusion must be as close as possible to a closed system,
- microthermometric measurements must be carefully calibrated,
- metastability and kinetic effects may affect some phase transitions,
- the selected models must be appropriate for the fluid composition,
- trapping estimates should be interpreted together with petrographic and geological observations.
In practice, FITane should be used as part of an integrated interpretation combining microthermometry, petrography, Raman spectroscopy when available, and geological context.
Geological applications
FITane can be used in a wide range of geological studies involving methane-bearing or carbon dioxide-bearing aqueous inclusions.
- sedimentary basin diagenesis,
- petroleum and gas migration studies,
- hydrothermal systems,
- low-temperature mineralization,
- studies of fluid circulation in fractured reservoirs.
By providing quantitative estimates of density and trapping conditions, the software helps reconstruct the evolution of fluids in the subsurface and their links with pressure, temperature and fluid-rock interaction.
Summary
FITane is a quantitative tool designed for the interpretation of fluid inclusions containing gas hydrates. It uses microthermometric observations to reconstruct fluid composition, density, and trapping conditions, with a particular focus on H2O-CH4-NaCl systems and related geological fluids.
The combination of numerical calculations, graphical outputs and multiple thermodynamic options makes it a valuable tool for both research and teaching in fluid geochemistry, ore deposits, sedimentary basin analysis and hydrothermal studies.