GEOD
point
The point command is the most basic geometric primitive used by GEOD, although it is rarely used on its own.
In practice, points are mainly used as markers, for example to follow the evolution of a point attached to a curve during an animation, or as control points for constructing other curves.
Summary
- Construction: position, range, and slope
- Position with x and y
- Slope with slope
- Range with range
- Left and right ranges with leftrange and rightrange
- Left and right slopes with leftslope and rightslope
- Graphic attributes: colors and symbols
- Color with color
- Size with size
- Scaling with markerscale
- Display symbols
- Filled and unfilled symbols with filled
- Line thickness with width
- Hide a point with hidden
- Relative motion arrows with lharpoon and rharpoon
- Display an image with icon
- Name a point with name
- Attach a point to a curve
Construction: position, range, and slope
In GEOD, a point is defined not only by its coordinates x and y, but also by its slope and its range.
Example:
  point x 125 y 50
      slope 35
      range 30
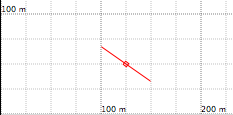
Figure 1: The point command.
The first line defines a point with coordinates x = 125 and y = 50. GEOD follows the usual coordinate conventions: the x axis runs from left to right, and the y axis runs upward. These two coordinates are mandatory arguments of the point command.
The following lines are optional and define additional geometric properties.
The subcommand slope specifies the dip, that is, the angle between the horizontal and the right-hand branch drawn by the point. This angle is measured in degrees, clockwise.
A value between 0 and 90 draws a branch dipping to the right, whereas a value between -90 and 0 draws a branch dipping to the left.
The subcommand range specifies the range, that is, the length of each arm of the point. For example, a range of 30 makes GEOD draw a line 60 units long, centered on the point.
The meaning of the range is not always immediately obvious. It is especially useful when defining the shape of Bézier curves. In practice, the range represents the approximate domain over which a locally measured dip remains valid.
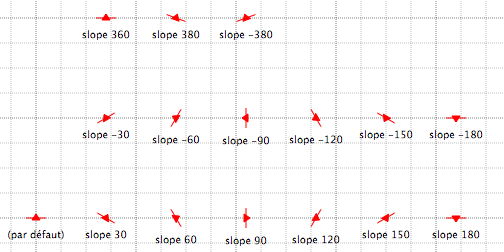
Figure 2: Setting the dip of a point with slope.
It is also possible to define asymmetric points, with different slopes and ranges on the left and right sides, using leftslope, rightslope, leftrange, and rightrange.
  point 100 200
      range 40
      leftslope 45
      rightslope 0
Note that leftslope follows the opposite convention from slope and rightslope. For a positive value on the left side, GEOD draws a half-line dipping to the left, and vice versa.
In the example above, the abbreviated syntax without the keywords x and y is used to define the point coordinates.
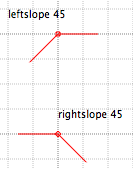
Figure 3: Left and right dips with leftslope and rightslope.
With leftrange and rightrange, the lengths of the left and right arms can be adjusted independently.
  point 100 200
      leftrange 20
      rightrange 40
      leftslope 45
      rightslope 0
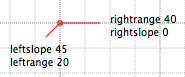
Figure 4: Left and right ranges with leftrange and rightrange.
Graphic attributes: colors and symbols
The appearance of a point can be customized with subcommands such as color, size, markerscale, width, filled, and others described below.
Change the color with color
The subcommand color changes the display color of the point symbol.
color blue
This sets the symbol color to blue.
The color names recognized by GEOD are:
- black
- dkgray
- gray
- ltgray
- red
- green
- blue
- cyan
- magenta
- yellow
- white
- brown
- cantaloupe
- honeydew
- spindrift
- sky
- lavender
- carnation
- salmon
- banana
- flora
- ice
- purple
- orange
A more precise color can also be specified numerically:
color 0.9 0.1 0.2
In this case, the three numbers are the red, green, and blue components. Each value must lie between 0 and 1.
Change the size with size
The subcommand size sets the display dimensions of the symbol.
size 10
This draws a marker within a square area 10 units wide and 10 units high.
Change the size with markerscale
The subcommand markerscale provides an alternative to size. It takes a single argument corresponding to a scale factor. A value greater than 1 enlarges the symbol, whereas a value smaller than 1 reduces it.
markerscale 2
This multiplies by 2 the dimensions previously defined by size.
Choose the display symbol
By default, GEOD draws a square 10 pixels wide. Other symbols can be selected with the following subcommands:
- circle — draws a circle
- verti — draws a vertical line
- square — draws a square
- diamond — draws a diamond
- cross — draws a cross
- xcross — draws an X-shaped cross
- triangle — draws an upward-pointing triangle
- dtriangle — draws a downward-pointing triangle
- asterisk — draws an asterisk
- vee — draws a V
- basevee — draws a V resting on a horizontal line
- dvee — draws an inverted V
- ltilda — draws a tilde-like symbol
- rtilda — draws a reversed tilde-like symbol
- crescent — draws an upward-facing crescent
- dcrescent — draws a downward-facing crescent
- house — draws a house-shaped symbol
- char — displays a character
- icon — displays an icon
- backarrow — draws an arrow seen from the back
- frontarrow — draws an arrow seen from the front
- plane — draws a dip symbol
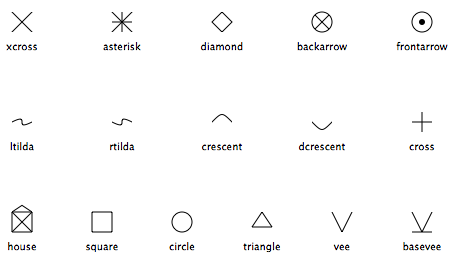
Figure 5: Choosing the display symbol of a point.
The subcommand plane is used to display a dip symbol. Without an argument, it shows a horizontal dip symbol, that is, a simple cross. To specify a dip of 30 degrees, write:
plane 30
The azimuth of the dip symbol is controlled by slope, and the length of the azimuth bar by range. Note that size and markerscale do not affect this type of marker. Use range instead. The length of the small bar representing the line of greatest slope depends on the dip value.
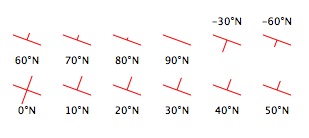
Figure 6: Displaying a dip symbol with plane.
To use a character as a marker, use char followed by the desired character. The character is automatically centered on the point.
char U
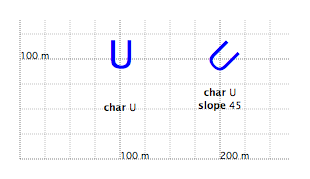
Figure 7: Using a character as a display symbol with char.
Convert open symbols into filled symbols with filled
The subcommand filled turns an open marker into a filled one.
The instruction
square
draws an open square, whereas
square filled
draws a filled square.
Set line thickness with width
The subcommand width changes the line thickness of the symbol.
width 2
This draws the symbol with a line thickness of 2 pixels.
Hide a point with hidden
The subcommand hidden disables the display of the point.
hidden
Invisible points can be useful as support points for other curves. For example, to define the subsidence movement of a compartment adjacent to a listric fault, two invisible points may be used, one as a pivot and the other as a guide sliding along the fault plane.
Use lharpoon and rharpoon to represent sinistral or dextral movement
The point command can also insert double arrows to indicate the relative motion along a fault by using lharpoon and rharpoon.
  point ...
      lharpoon
This draws two joined arrows indicating a sinistral movement.
To indicate a dextral movement, use rharpoon.
The spacing between the two arrows can be adjusted with size:
  point ...
      lharpoon
      size 10
This inserts arrows spaced 10 pixels apart.
The arrow length can be changed with range.
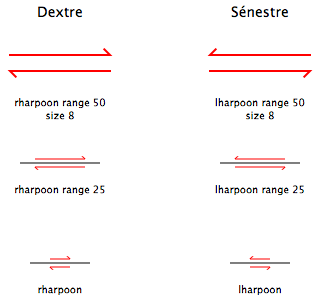
Figure 8: The lharpoon and rharpoon subcommands used to indicate relative fault movement.
Display an image with icon
The point command can also display an image with the subcommand icon, using the following syntax:
  point ...
      icon "filename"
Here, filename must be replaced by the name of the graphic file containing the image. Common formats such as PDF, Photoshop, PNG, and JPEG are recognized. The image is centered on the point.
The image file should normally be stored in the same folder as the script currently being edited. In some cases, it may be necessary to save the script first so that GEOD can locate the file correctly.
Images stored in other folders can also be used, either with a relative path:
  point ...
      icon "../icons/sedim/s0.pdf"
or with an absolute path:
  point ...
      icon "/Documents/icons/sedim/s0.pdf"
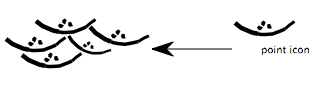
Figure 9: The icon "..." instruction for displaying an image.
The size of the image can be modified with markerscale. The image can also be rotated using slope.
The icon subcommand is best reserved for small images such as icons. For larger images, use the image command instead. If the same image must be repeated several times, it is better to use fill, which is more suitable for repeated icons.
The name subcommand
The subcommand name is used to assign a name to a point.
name p0
This subcommand is very general. It is not limited to points and can also be used for other lines or objects in a cross-section. It is mainly used to associate graphical objects with one another.
Attaching a point to a curve
A point can be attached to a curve. It can then be used as a marker or reference point on that curve. For this functionality, see the corresponding section in the line command documentation.