FIT-OIL
Screenshots
This page provides a visual overview of the FIT-Oil interface and its main functions. It complements the tutorial by showing the main windows, dialog boxes and plots used in the software.
The screenshots below are organized by function so that users can quickly find the part of the interface related to a given task.
- Overview and workspace
- Alpha-Beta model
- Phase diagrams
- Fluid inclusions and Fv-T plots
- Fluid models
- Excel worksheets
- Browse by platform
Overview and workspace
These screenshots provide a general view of the FIT-Oil workspace, menus and contextual menus.
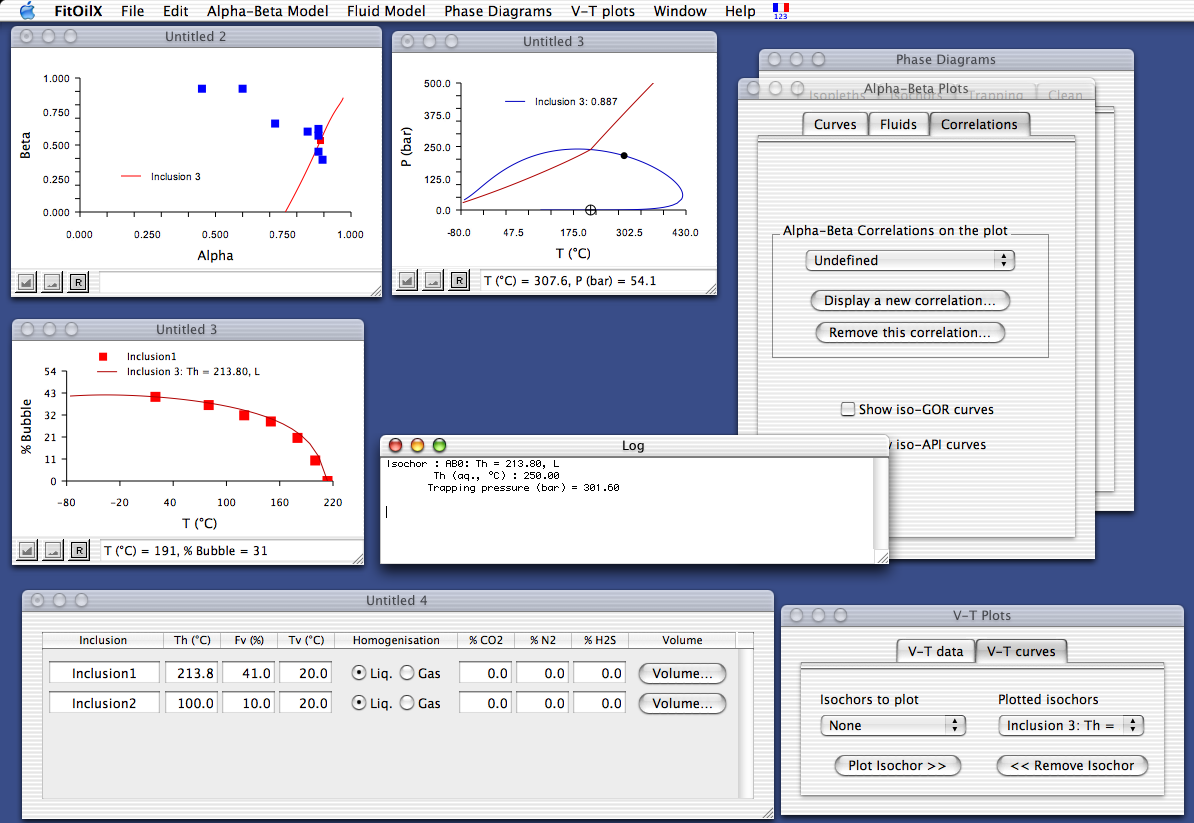
A complete view of the FIT-Oil user workspace.
Menus
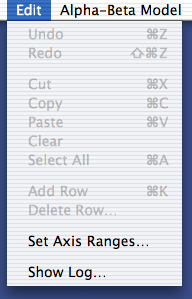
The Edit menu.
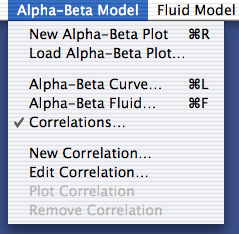
The Alpha-Beta Model menu.
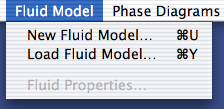
The Fluid Model menu.
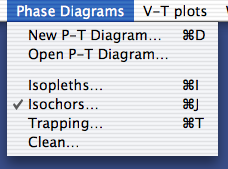
The Phase Diagrams menu.
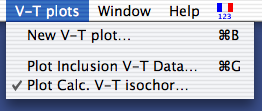
The Fv-T plots menu.
Contextual menus
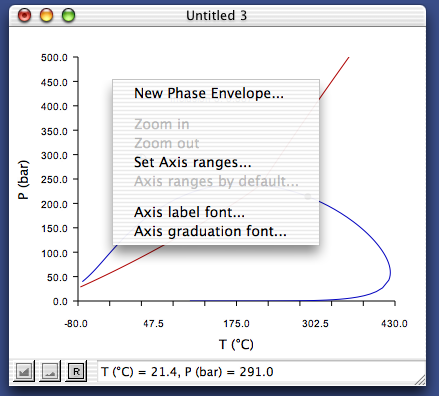
An example of a contextual menu in a phase diagram.
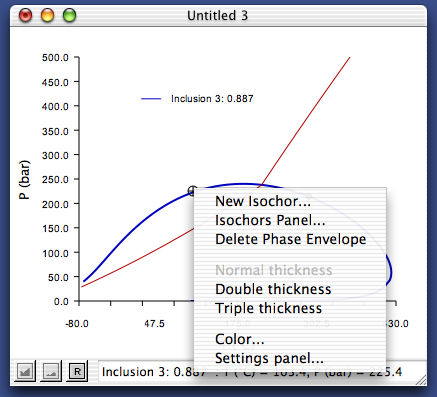
Contextual menu for isopleths.
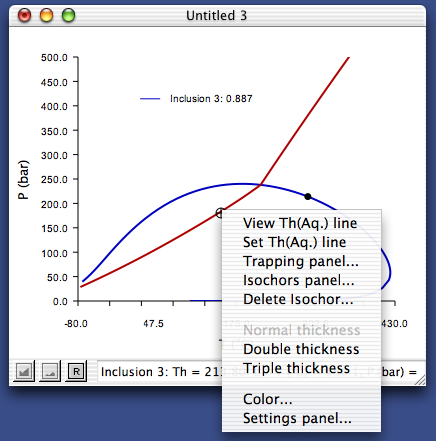
Contextual menu for isochors.
Alpha-Beta model
This section illustrates the main windows used to calculate, visualize and interpret alpha-beta curves, alpha-beta fluids, correlations, and derived quantities such as GOR and API.
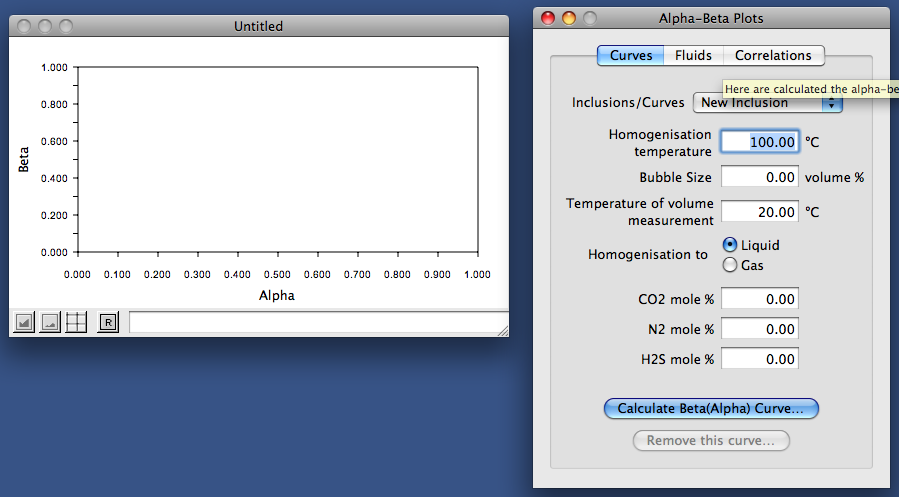
The calculation of alpha-beta curves: the plot window (left) with the floating window (right).
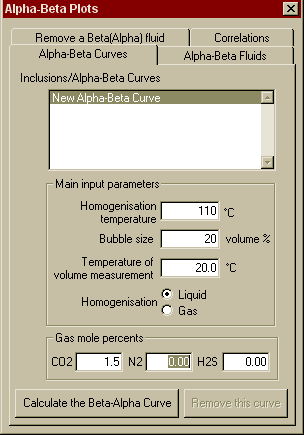
The Alpha-Beta Curves panel.
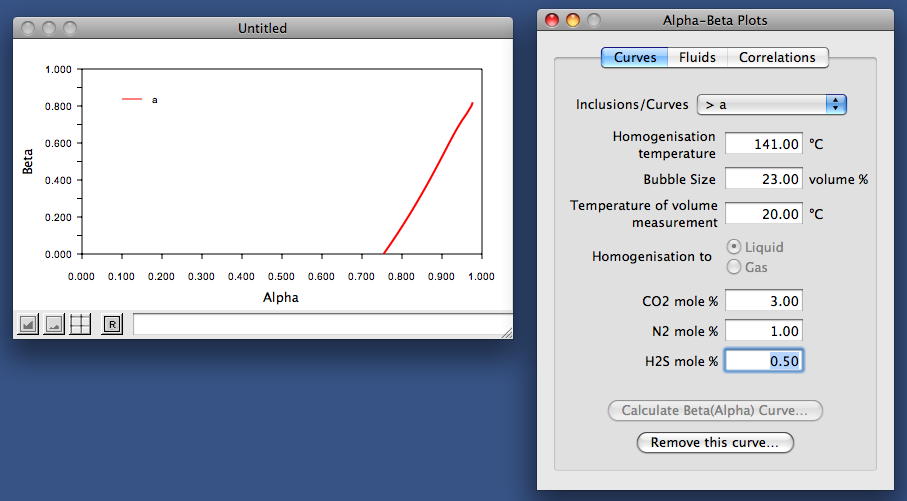
The calculation of alpha-beta curves: the result. The full solid curve is the locus of possible (alpha, beta) points for the specified parameters in the Alpha-Beta plots panel.
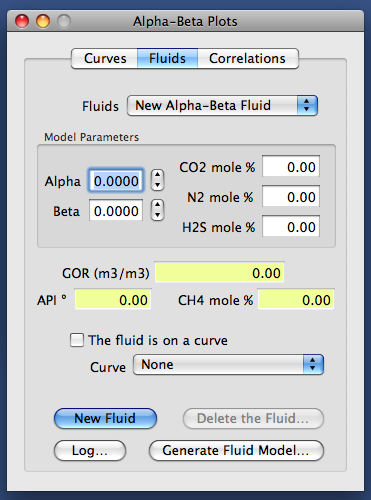
The Alpha-Beta Fluids panel.
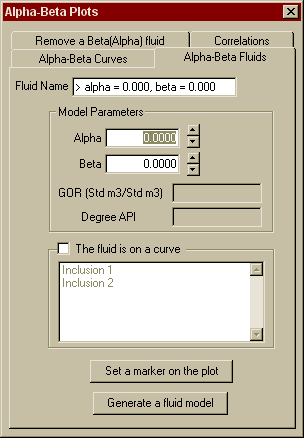
The Alpha-Beta Fluids panel.
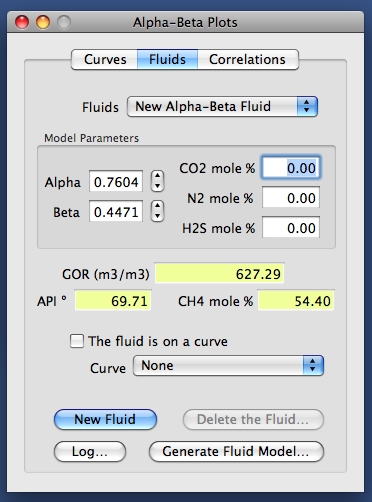
The display of GOR and API degree.
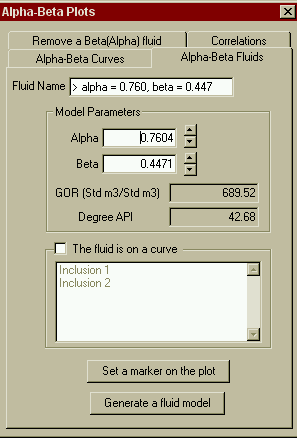
The display of GOR and API degree.
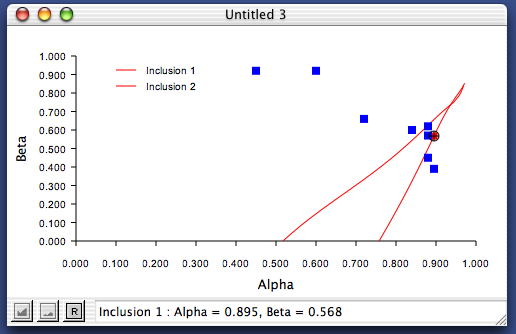
Alpha-Beta plots. Red lines: calculated alpha-beta curves. Red squares: user-selected alpha-beta fluids. Blue squares: an alpha-beta correlation.
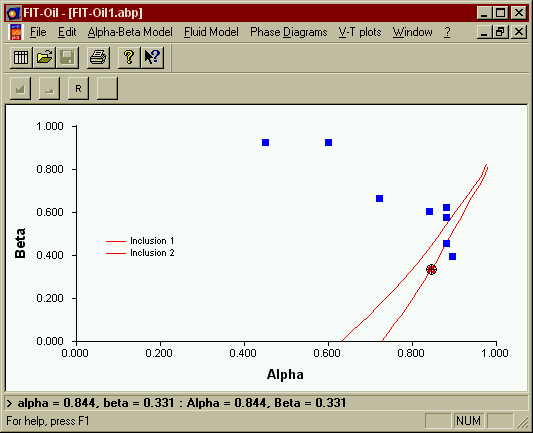
Alpha-Beta plots. Red lines: calculated alpha-beta curves. Red squares: user-selected alpha-beta fluids. Blue squares: an alpha-beta correlation.
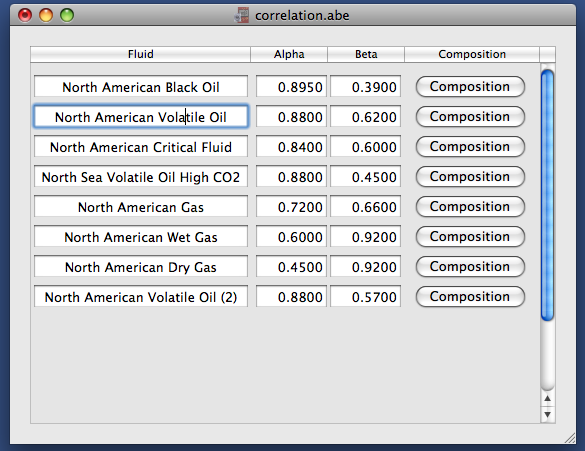
An example of alpha-beta correlation.
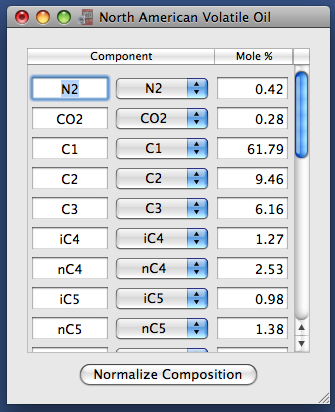
An example of an alpha-beta fluid: this window displays the theoretical molecular composition used internally by FIT-Oil to describe the thermodynamic properties of a petroleum.
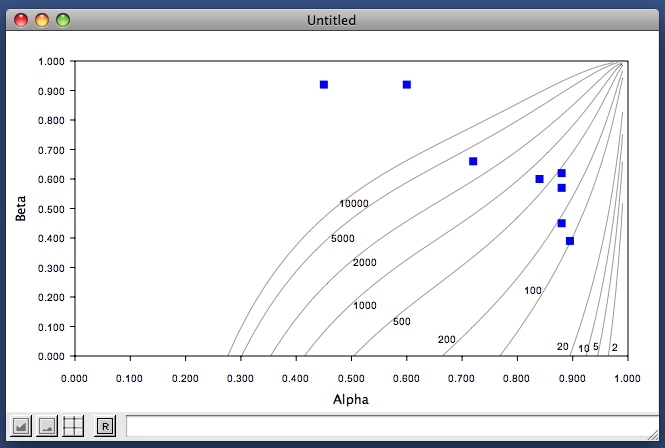
Iso-GOR curves.
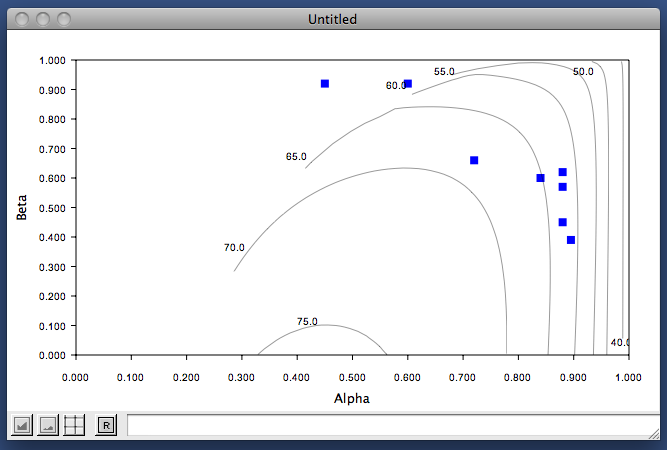
Iso-API curves.
Phase diagrams
These screenshots show the main tools used in the Phase Diagrams module, including isopleths, isochors, trapping lines and related plots.
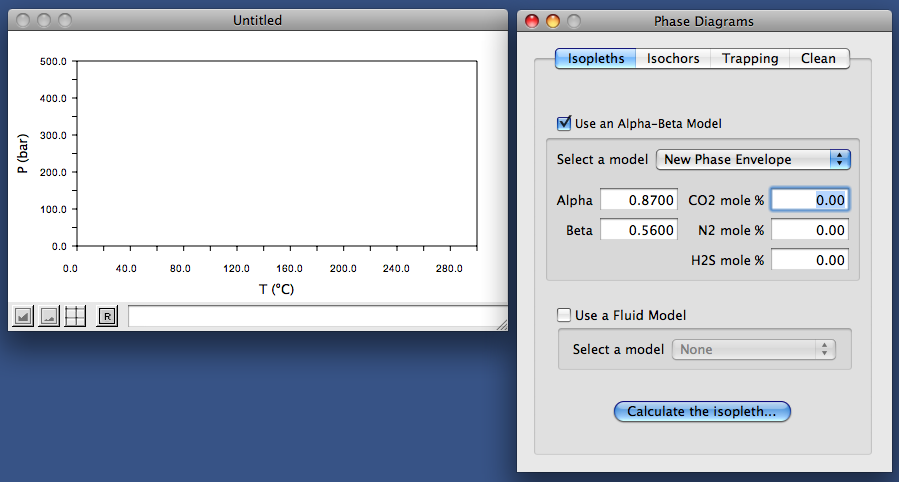
The Isopleths panel of the Phase Diagrams window.
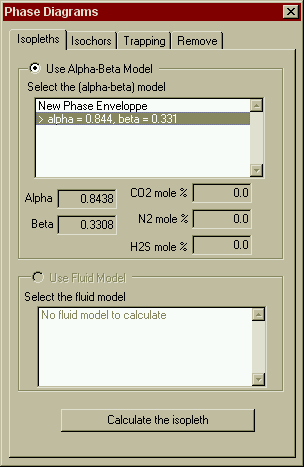
The Isopleths panel of the Phase Diagrams window.
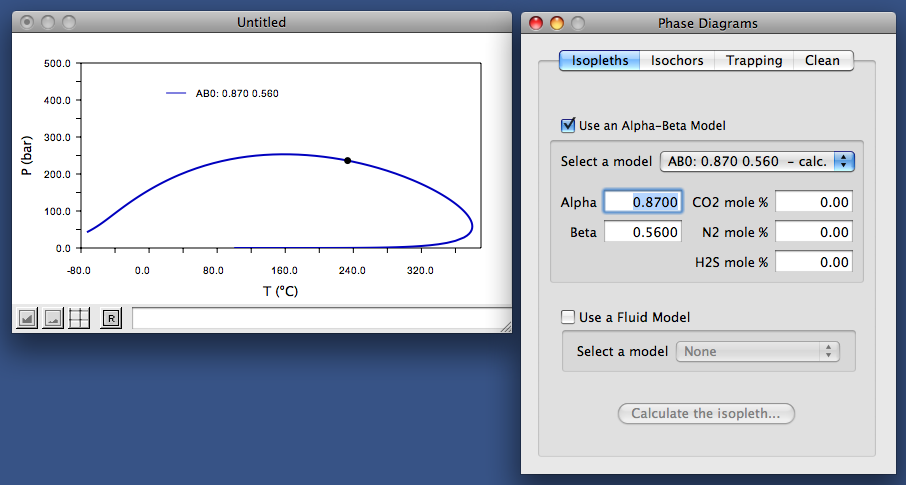
The Phase Diagram window with a calculated gas-liquid immiscibility loop.
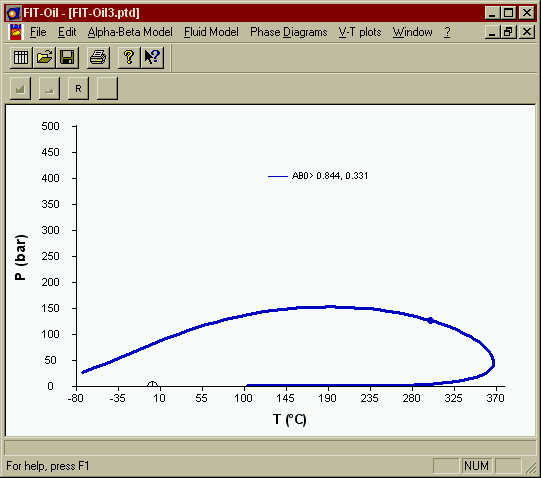
The Phase Diagram window with a calculated gas-liquid immiscibility loop.
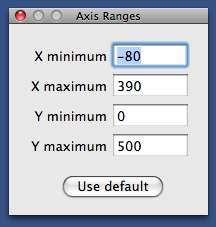
The Axis ranges dialog box.
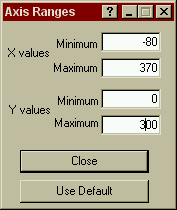
The Axis ranges dialog box.
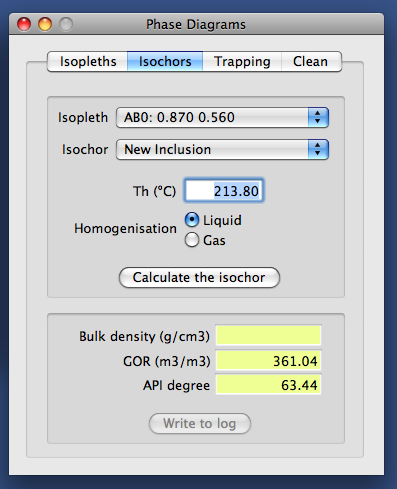
The Isochors panel of the Phase Diagrams floating window.
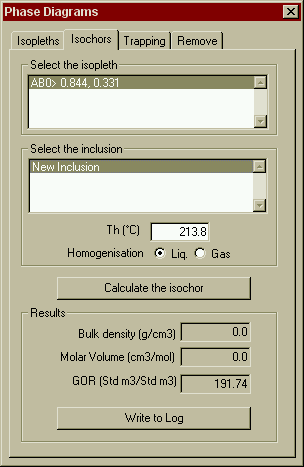
The Isochors panel of the Phase Diagrams floating window.
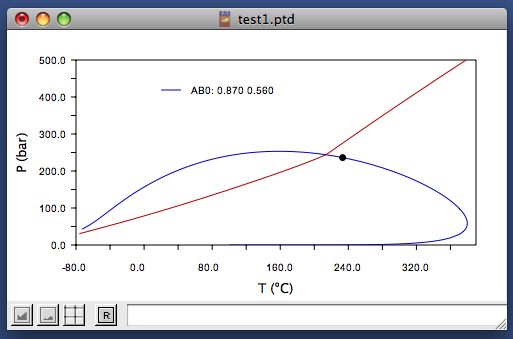
The phase diagram window showing the new calculated isochor (red line).
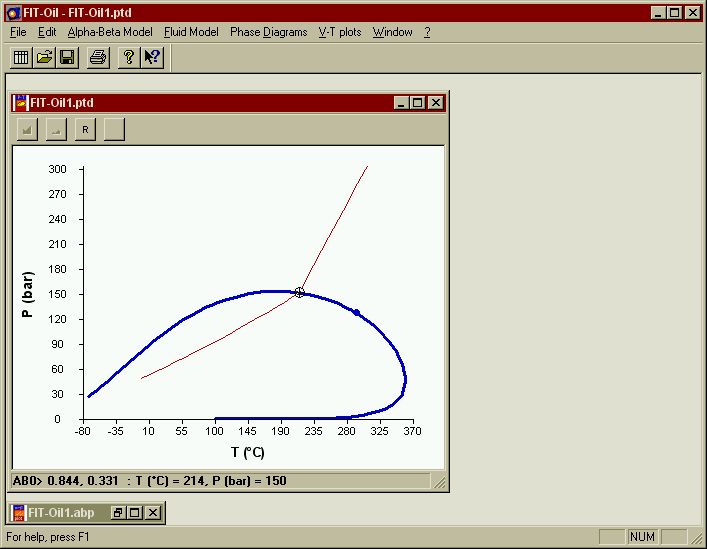
The phase diagram window showing the new calculated isochor (red line).
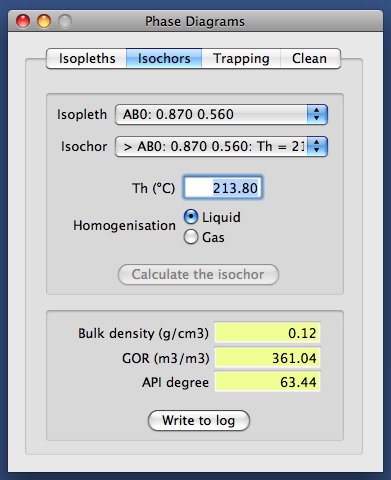
The display of GOR and API° of the new isochor.
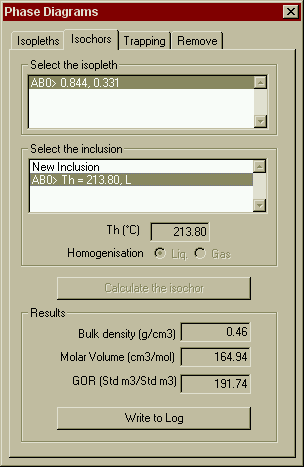
The display of GOR and API° of the new isochor.
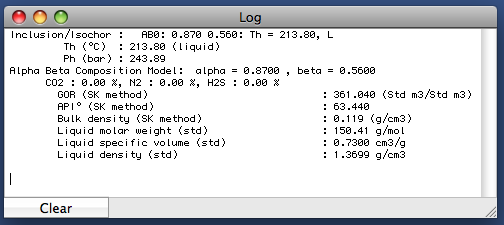
The Log window, showing detailed information about the selected isochor.
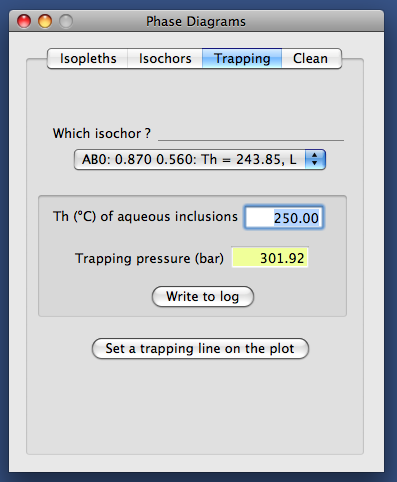
The Trapping panel of the Phase Diagrams floating window.
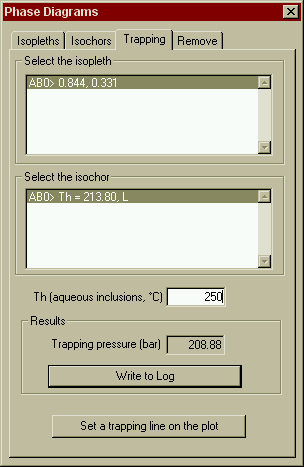
The Trapping panel of the Phase Diagrams floating window.
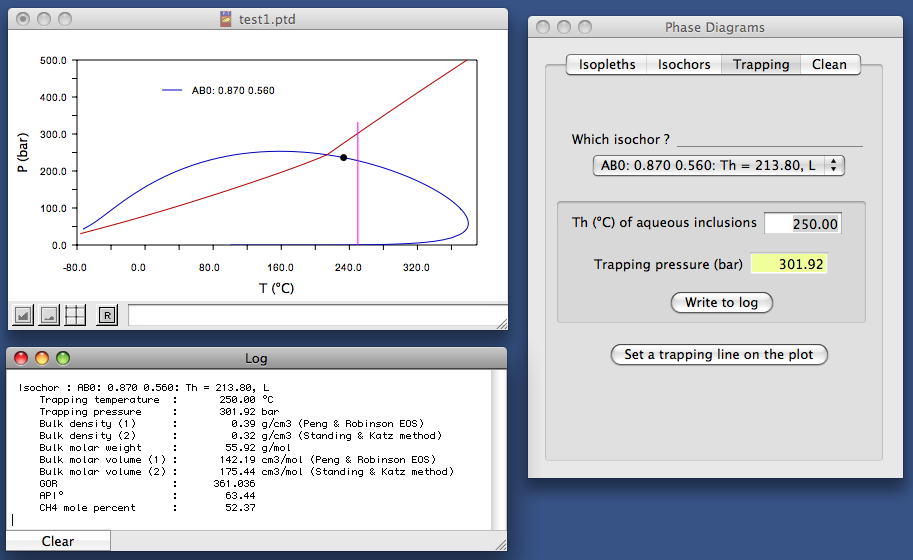
The trapping line in the phase diagram and the results displayed in the log window.
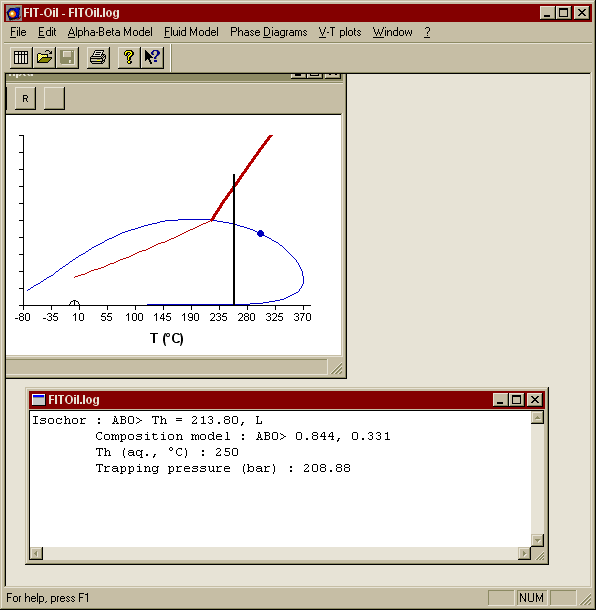
The trapping line in the phase diagram and the results displayed in the log window.
Fluid inclusions and Fv-T plots
This section gathers screenshots related to the input of fluid inclusion data and the generation of Fv-T plots.
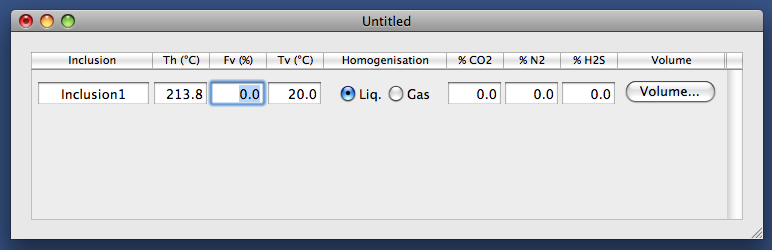
The data input window for microthermometric data of inclusions.
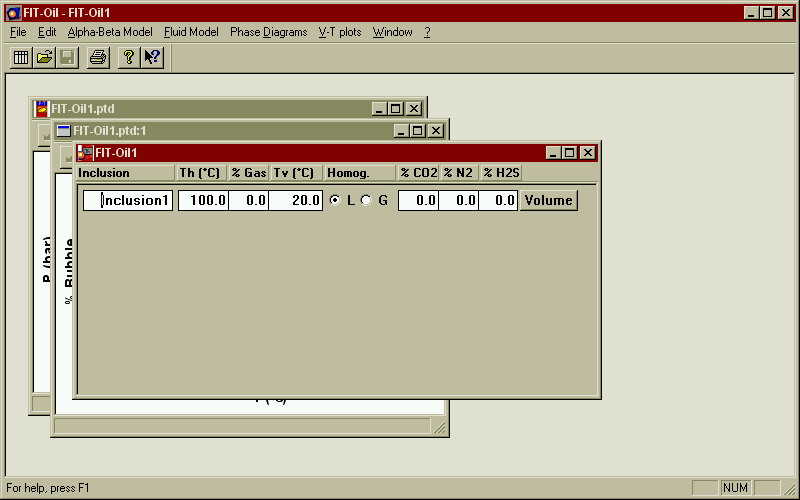
The data input window for microthermometric data of inclusions.
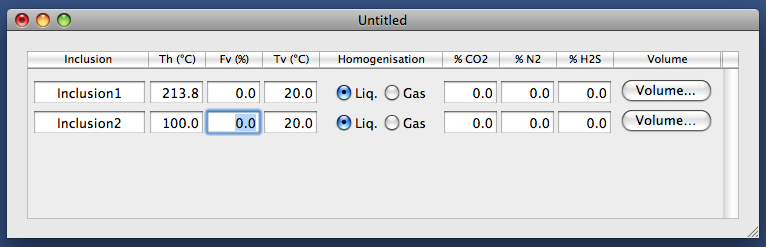
To add microthermometric data of another inclusion.
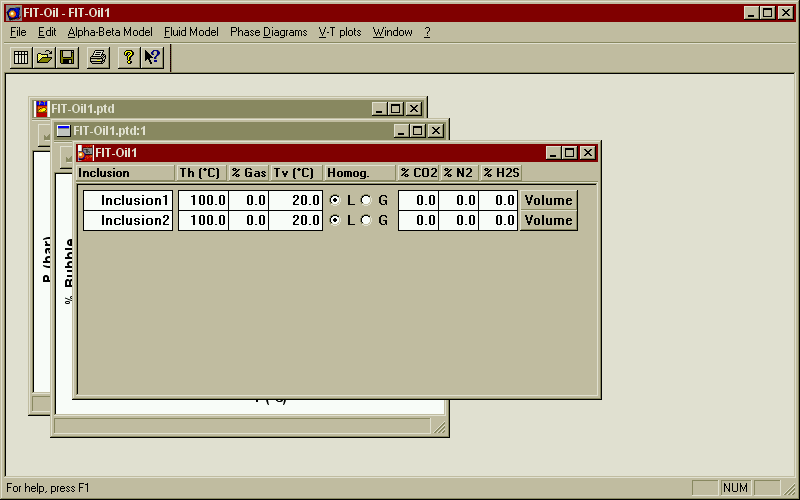
To add microthermometric data of another inclusion.
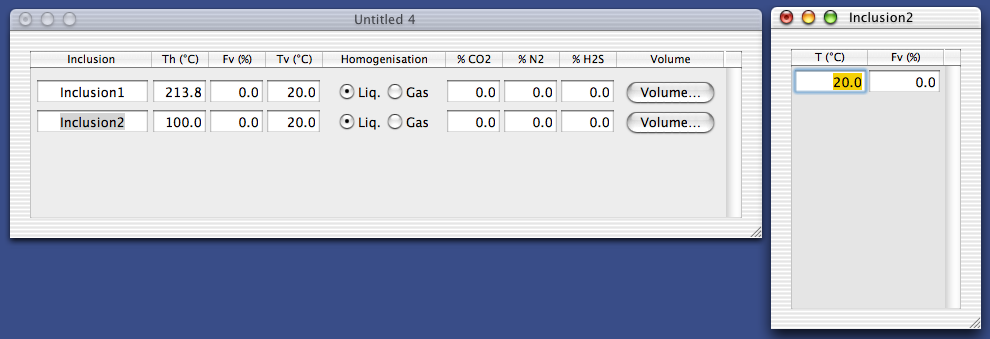
The data input windows for microthermometric and volumetric data of inclusions.
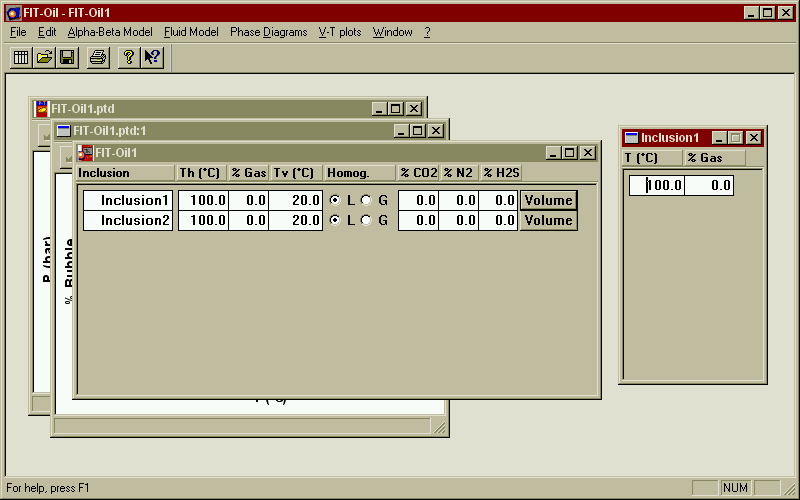
The data input windows for microthermometric and volumetric data of inclusions.
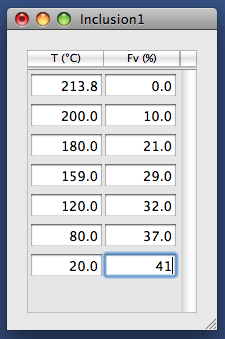
The data input window for bubble filling degrees, once all data have been entered.
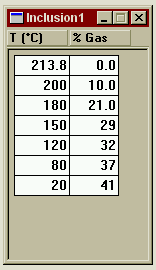
The data input window for bubble filling degrees, once all data have been entered.
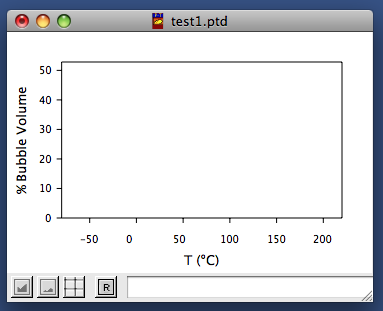
An empty Fv-T plot window.
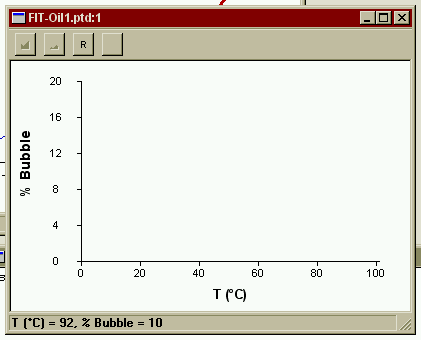
An empty Fv-T plot window.
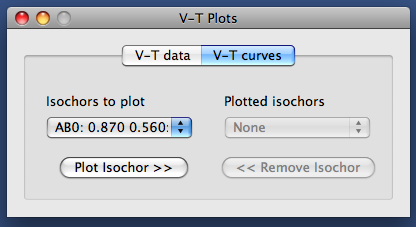
The Plot Fv(T) curve... floating window.
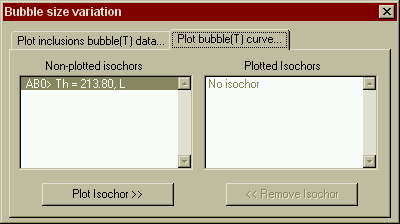
The Plot Fv(T) curve... floating window.
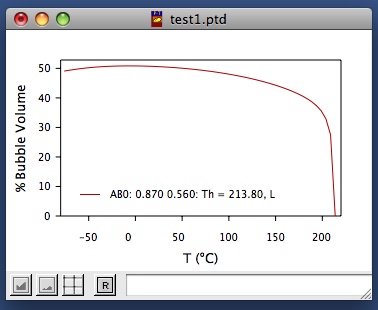
The bubble Fv(T) curve calculated for an inclusion.
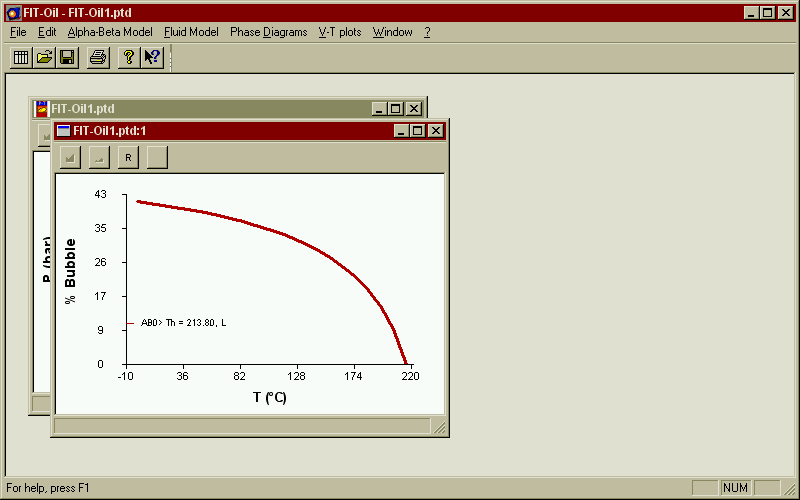
The bubble Fv(T) curve calculated for an inclusion.
The V-T data panel of the V-T plots floating window.
The V-T data panel of the V-T plots floating window.
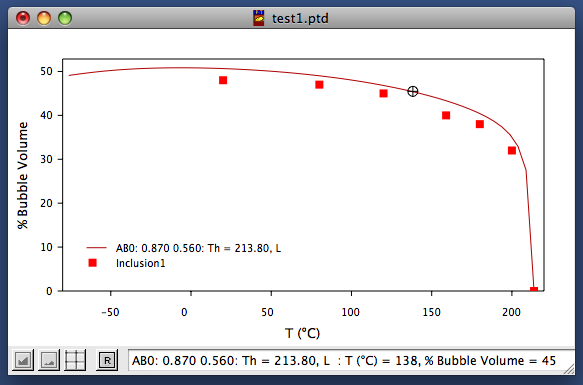
The final Fv-T plot window.
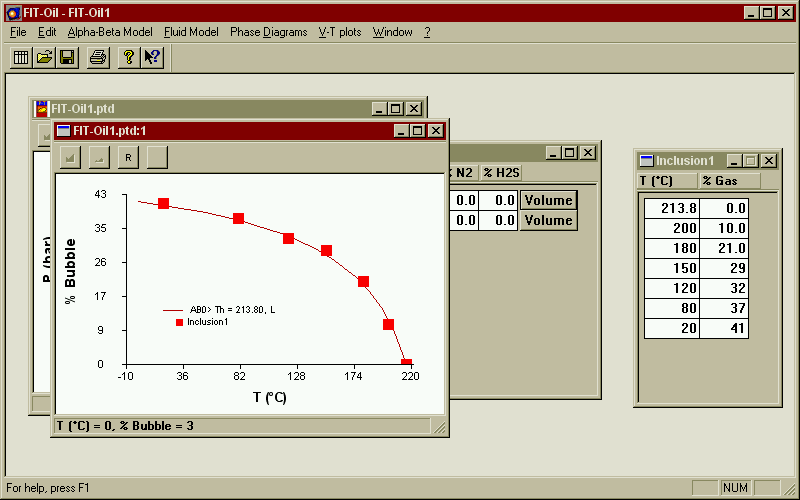
The final Fv-T plot window.
Fluid models
These screenshots illustrate the generation, visualization and interpretation of fluid models derived from alpha-beta models.
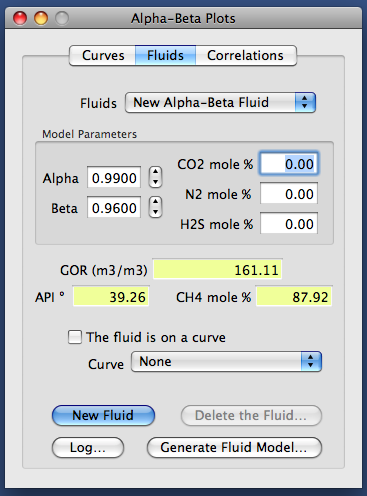
Click the Generate Fluid Model... button to create a fluid model from an alpha-beta model.
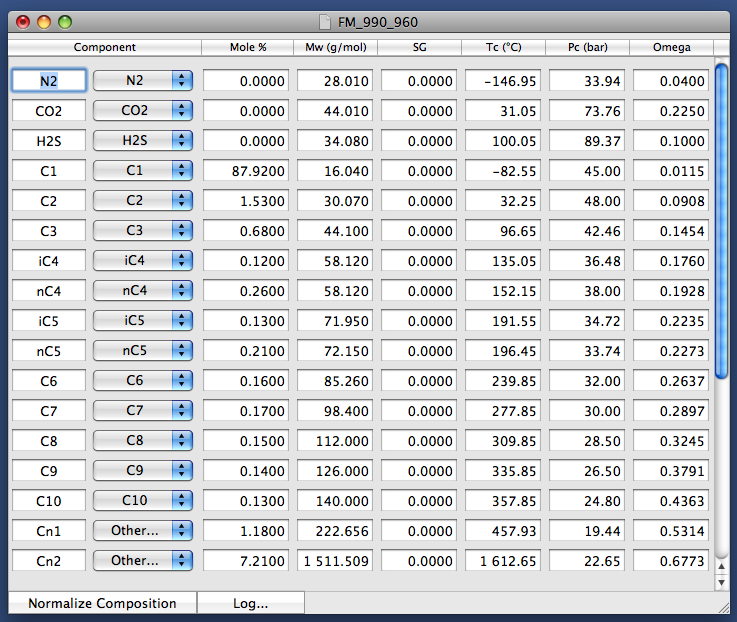
Here is the fluid model created from the alpha-beta model mentioned above.
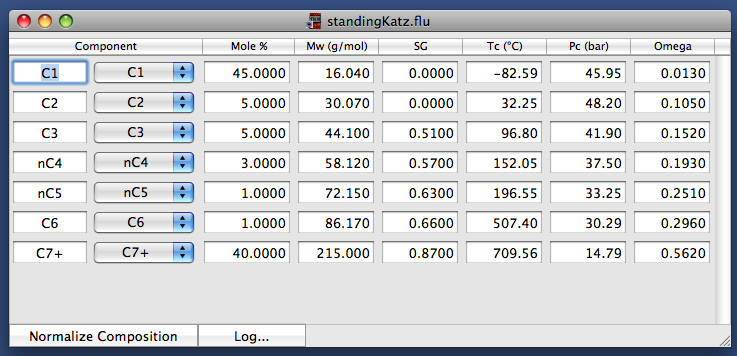
An example of fluid model displayed in its editor window.
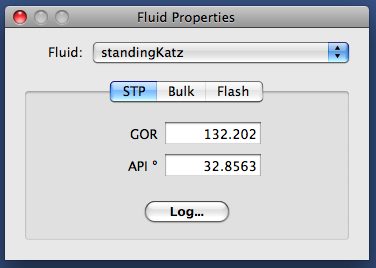
The panel STP of the Fluid Properties dialog box.
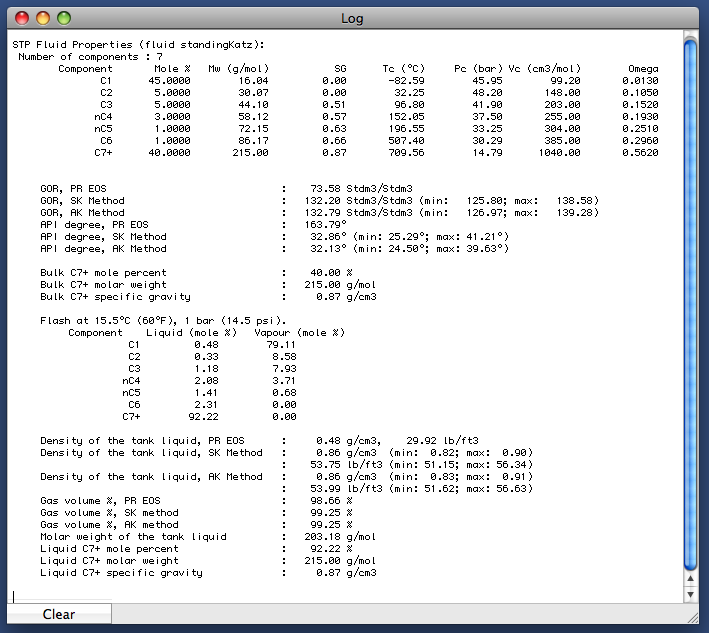
The results for flash calculations under STP conditions displayed in a log window.
Excel worksheets
FIT-Oil data can also be exported to Excel worksheets. The screenshots below illustrate the structure of the imported data.
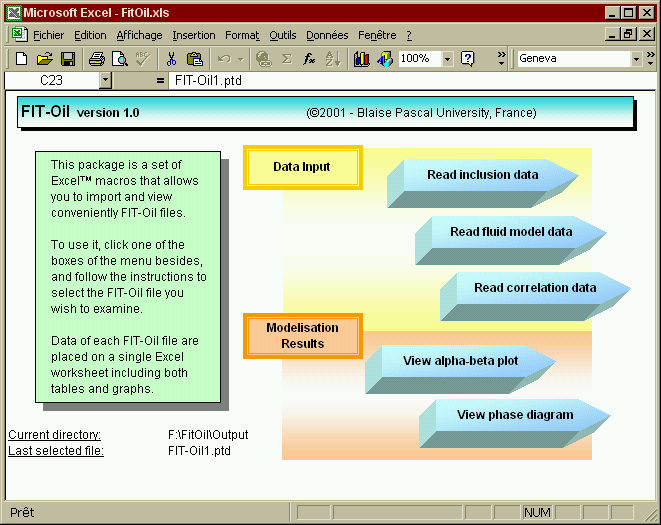
The main Excel worksheet to import data from FIT-Oil.
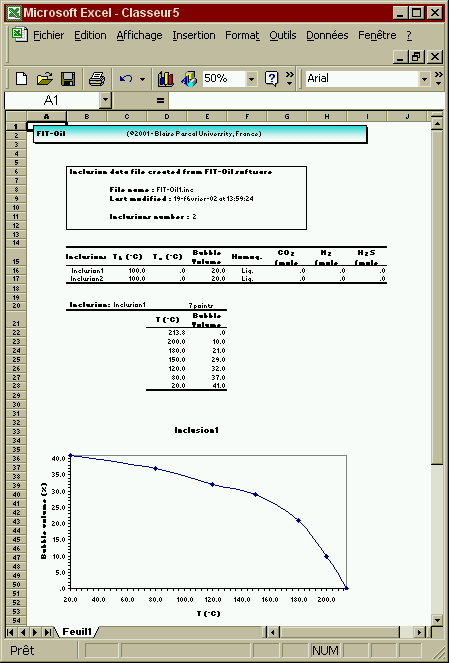
The Excel worksheet showing imported microthermometric and volumetric data from FIT-Oil.
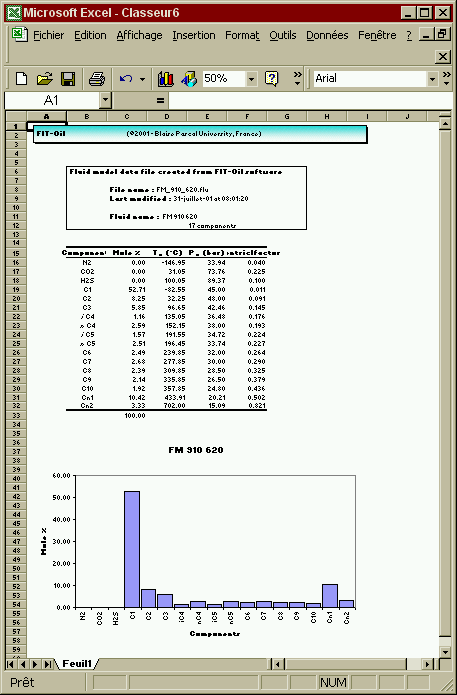
The Excel worksheet showing imported fluid model data from FIT-Oil.
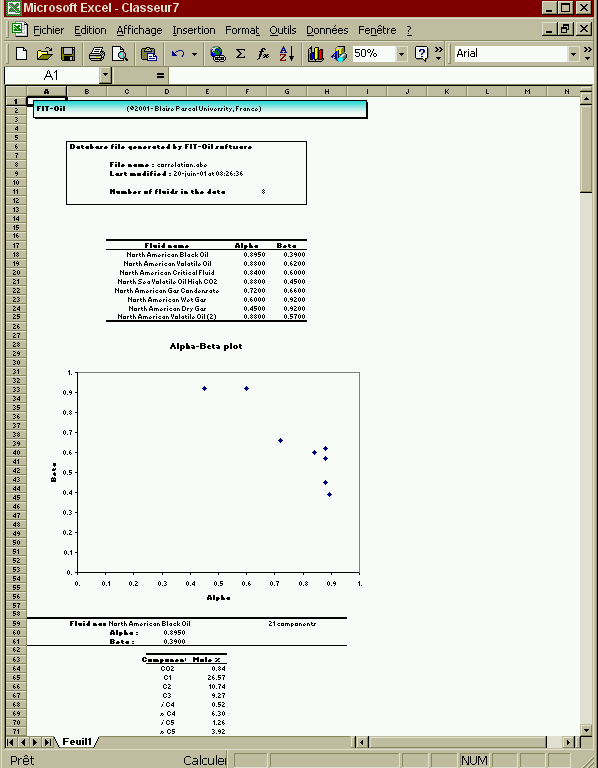
The Excel worksheet showing an imported alpha-beta correlation from FIT-Oil.
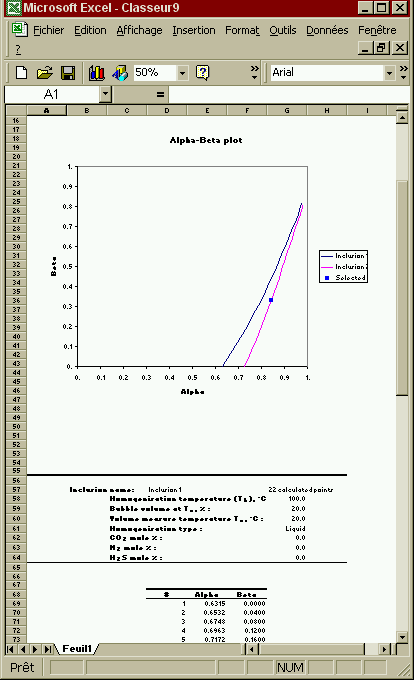
The Excel worksheet showing an imported alpha-beta plot from FIT-Oil.
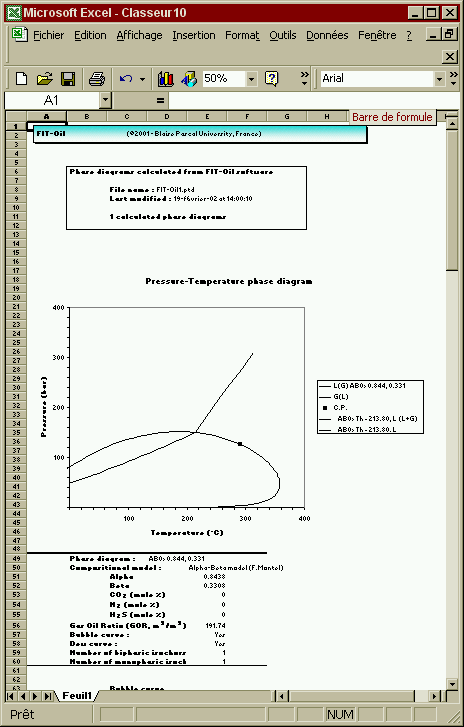
The Excel worksheet showing an imported phase diagram from FIT-Oil.